Introduction
Memory corruption can occur due to various bugs or defects: Uninitialized Memory Reads (UMR), Use After Free (UAF), Use After Return (UAR), double-free, memory leakage, or illegal Out Of Bounds (OOB) accesses that attempt to work upon (read/write/ execute) illegal memory regions.
Since memory is dynamically allocated and freed via the kernel’s engine – the page allocator. This can lead to serious wastage (internal fragmentation) of memory. To mitigate this, the slab allocator (or slab cache) is layered upon it, serving two primary tasks – providing fragments of pages efficiently (within the kernel, allocation requests for small pieces of memory, from a few bytes to a couple of kilobytes), and serving as a cache for commonly used data structures.
Note: memory is allocated in following hierarchy
Page allocator → gives pages
SLUB → splits pages into objects
SLUB debug → adds metadata + checks
This blog will explain to basics of debugging a slab memory corruption via SLUB debug.
Requirements
We will be using the code example from
https://github.com/ankitkhushwaha/Linux-Kernel-Debugging-tutorials
So make sure to clone it.
Enable CONFIG_SLUB_DEBUG
Following configs are needed to use this feature.
$ grep SLUB_DEBUG /boot/config-6.18.7-200.fc43.x86_64
CONFIG_SLUB_DEBUG=y
# CONFIG_SLUB_DEBUG_ON is not set
This config implies that SLUB debugging is available but disabled by default (as CONFIG_ SLUB_DEBUG_ON is off). It is Usually disabled in production due to overhead; enable only for debugging.
The slub_debug Kernel Parameter
To leverage SLUB debug features we need to boot the kernel with slub_debug parameter.
| Flag | Description |
|---|---|
| Null(empty after slub_debug=) | Switch all Slub debugging On. |
| F | Sanity checks (consistency checks) on SLUB objects. Detects basic corruption of the freelist or slab structure. |
| Z | Red zoning around objects (guard zones). Detects out-of-bounds (OOB) writes into adjacent memory areas. |
| P | Poisoning (object and padding areas). Detects access to uninitialized memory or use-after-free (UAF) errors when reallocating an object. |
| U | User tracking (store user info for alloc/free). Provides stack traces of the last allocation and free operations in bug reports, aiding root cause analysis. |
| T | Trace all allocations/frees. Use only on single slabs due to high verbosity. Provides detailed, continuous tracing of memory operations for a specific cache. |
| A | Toggle failslab filter mark for the cache. Used for testing error handling by simulating allocation failures. |
| O | Switch debugging off for caches that would cause higher minimum slab orders. Prevents debugging from forcing large page allocations, which can cause memory allocation errors in low-memory situations. |
| - | Switch all debugging off (useful if the kernel is compiled with CONFIG_SLUB_DEBUG_ON). Disables all debugging for specified caches or globally. |
Note - Kernel also provides way to enable flags for Specific slub inside ‘/sys/kernel/slab/slabname’ folder.
Understanding the SLUB layer’s poison flags
The poison flags defined by the kernel are defined as follows:
// include/linux/poison.h

/* ...and for poisoning */
#define POISON_INUSE    0x5a    /* for use-uninitialised poisoning */
#define POISON_FREE     0x6b    /* for use-after-free poisoning */
#define POISON_END      0xa5    /* end-byte of poisoning */
- When you use the SLAB_POISON flag when creating a slab cache (typically via the kmem_cache_create() kernel API) or set poisoning to on via the kernel parameter slub_debug=P, the slab memory gets auto-initialized to the value 0x6b (which is ASCII k, corresponding to the POISON_FREE macro). In effect, when this flag is enabled, this (0x6b) is the value that valid but uninitialized slab memory regions are set to on creation.
- The POISON_INUSE value (0x5a equals ASCII Z) is used to denote padding zones, before or after red zones.
- The last legal byte of the slab memory object is set to POISON_END, 0xa5.
Boot the Kernel
Boot the kernel with slub_debug=FZPU
After booting the kernel You should see something like this.
$ cat /proc/cmdline
BOOT_IMAGE=(hd0,gpt2)/vmlinuz-6.18.7-200.fc43.x86_64 root=UUID=94fc6fde-521c-4d20-9cba-84dba8146a75 ro rootflags=subvol=root slub_debug=FZPU quiet splash crashkernel=2G-64G:256M,64G-:512M
Note: if kernel is build with KASAN support then it will catch the bug[discussed below] first. Try this in Production kernel built without KASAN support.
Reproduce the bug
All test cases are defined in: ch5/kmembugs_test/kmembugs_test.c
$ cd ch5/kmembugs_test
$ sudo ./load_testmod     # build & load the kernel module
$ sudo ./run_tests        # input the test number
5.2
[  160.928464] testcase to run: 5.2
[  160.928479] [Right Redzone overwritten] 0xffff8de137751680-0xffff8de137751683 @offset=1664. First byte 0x78 instead of 0xcc
[  160.928483] =============================================================================
[  160.928485] BUG kmalloc-rnd-04-32 (Tainted: G           OE      ): Object corrupt
[  160.928487] -----------------------------------------------------------------------------

[  160.928488] Allocated in dynamic_mem_oob_right+0x57/0xb0 [test_kmembugs] age=0 cpu=6 pid=7847
[  160.928494]  __kmalloc_cache_noprof+0x3ae/0x5c0
[  160.928499]  dynamic_mem_oob_right+0x57/0xb0 [test_kmembugs]
[  160.928501]  dbgfs_run_testcase+0x2ee/0x3c0 [test_kmembugs]
[  160.928504]  full_proxy_write+0x54/0x80
[  160.928508]  vfs_write+0xce/0x480
[  160.928512]  ksys_write+0x73/0xf0
[  160.928514]  do_syscall_64+0x7e/0x7f0
[  160.928520]  entry_SYSCALL_64_after_hwframe+0x76/0x7e
[  160.928524] Freed in rtw_iterate_vifs+0xa2/0xe0 [rtw88_core] age=2936 cpu=5 pid=1405
[  160.928543]  rtw_iterate_vifs+0xa2/0xe0 [rtw88_core]
[  160.928554]  rtw_watch_dog_work+0x25a/0x320 [rtw88_core]
[  160.928562]  process_one_work+0x192/0x350
[  160.928566]  worker_thread+0x25a/0x3a0
[  160.928569]  kthread+0xfc/0x240
[  160.928571]  ret_from_fork+0xf4/0x110
[  160.928575]  ret_from_fork_asm+0x1a/0x30
[  160.928578] Slab 0xfffff6f104ddd440 objects=25 used=22 fp=0xffff8de137751de0 flags=0x17ffffc0000200(workingset|node=0|zone=2|lastcpupid=0x1fffff)
[  160.928583] Object 0xffff8de137751660 @offset=1632 fp=0xffff8de137751de0

[  160.928585] Redzone  ffff8de137751640: cc cc cc cc cc cc cc cc cc cc cc cc cc cc cc cc  ................
[  160.928587] Redzone  ffff8de137751650: cc cc cc cc cc cc cc cc cc cc cc cc cc cc cc cc  ................
[  160.928588] Object   ffff8de137751660: 6b 6b 6b 6b 6b 6b 6b 6b 6b 6b 6b 6b 6b 6b 6b 6b  kkkkkkkkkkkkkkkk
[  160.928590] Object   ffff8de137751670: 6b 6b 6b 6b 6b 6b 6b 6b 6b 6b 6b 6b 6b 6b 6b a5  kkkkkkkkkkkkkkk.
[  160.928591] Redzone  ffff8de137751680: 78 cc cc 78 cc cc cc cc                          x..x....
[  160.928592] Padding  ffff8de1377516d4: 5a 5a 5a 5a 5a 5a 5a 5a 5a 5a 5a 5a              ZZZZZZZZZZZZ

[...]

[  160.928946] ---[ end trace 0000000000000000 ]---
[  160.928948] FIX kmalloc-rnd-04-32: Restoring Right Redzone 0xffff8de137751680-0xffff8de137751683=0xcc
[  160.928950] FIX kmalloc-rnd-04-32: Object at 0xffff8de137751660 not freed
Test case
int dynamic_mem_oob_right(int mode)
{
	volatile char *kptr, ch = 0;
	char *volatile ptr;
	size_t sz = 32;

	kptr = kmalloc(sz, GFP_KERNEL);
	if (unlikely(!kptr))
		return -ENOMEM;

	ptr = (char *)kptr + sz + 3; // right OOB

	if (mode == READ) {
	ch = *(volatile char *)ptr;
	ch = kptr[sz+3];
	}
	else if (mode == WRITE)	{
		*(volatile char *)ptr = 'x';  // invalid, OOB right write
		kptr[sz] = 'x';	// invalid, OOB right write
	}

	kfree((char *)kptr);
	return 0;
}
Test case does the following:
- performed a dynamic memory allocation of 32 bytes memory.
- write a out of bound (OOB) region.
First INFO line spits out the start and end of the corrupted memory region.
[ 160.928479] [Right Redzone overwritten] 0xffff8de137751680-0xffff8de137751683 @offset=1664. First byte 0x78 instead of 0xcc
Note that these kernel virtual addresses are hashed here, for security, preventing info leaks.
Second INFO line shows where the buggy access took place in the code – via the usual +0xoff_from_func/0xlen_of_func [modname] notation. (Here, it happens to be dynamic_mem_oob_right+0x57/0xb0.
We haven’t shown the full stack call trace here. Read it bottom-up, ignoring any lines that begin with ‘?’.
We have allocated a memory of 32 bytes shown by
[  160.928588] Object   ffff8de137751660: 6b 6b 6b 6b 6b 6b 6b 6b 6b 6b 6b 6b 6b 6b 6b 6b  kkkkkkkkkkkkkkkk
[  160.928590] Object   ffff8de137751670: 6b 6b 6b 6b 6b 6b 6b 6b 6b 6b 6b 6b 6b 6b 6b a5  kkkkkkkkkkkkkkk.
The poison value 0x6b denotes the value that’s used to initialize the valid slab memory region, 0xa5 denotes the end poisoning marker byte, and 0x5a denotes use-uninitialized poisoning.
The last byte was initialized with POISON_END bit (0xa5) and the value 0x78 is our x character being (wrongly) written by the test case outside of the allocated memory.
[ 160.928591] Redzone ffff8de137751680: 78 cc cc 78 cc cc cc cc x..x....
This tell us that Right redzone of concerned memory was being overwritten with value ‘0x78’ in ascii ‘x’. In last Lines of logs We can see that Slab framework corrected the memory by restoring it to previous POISON_FLAG.
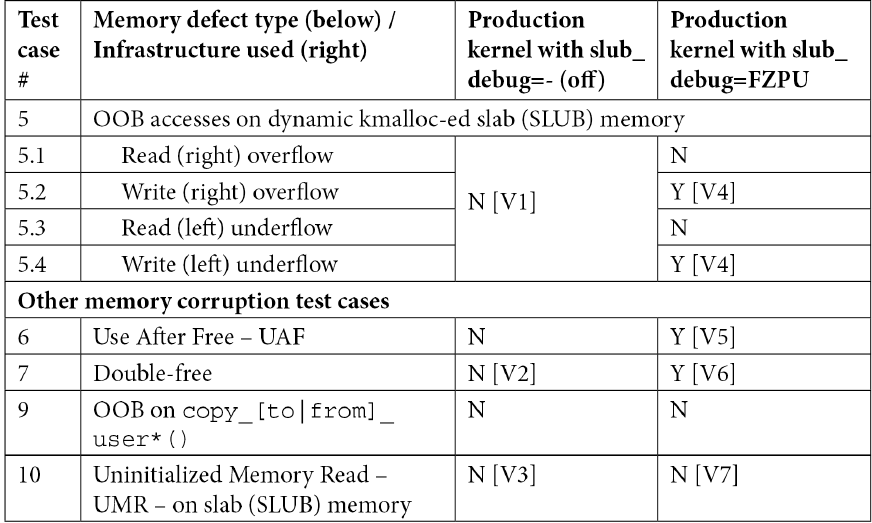
Conclusion
while the kernel SLUB debug framework seems to catch most of the memory corruption issues on slab memory, it doesn’t seem to catch the read OOB accesses on slab memory. Though it is reliable tool to detect memory corruption in production kernels.
It can catch the following bugs-